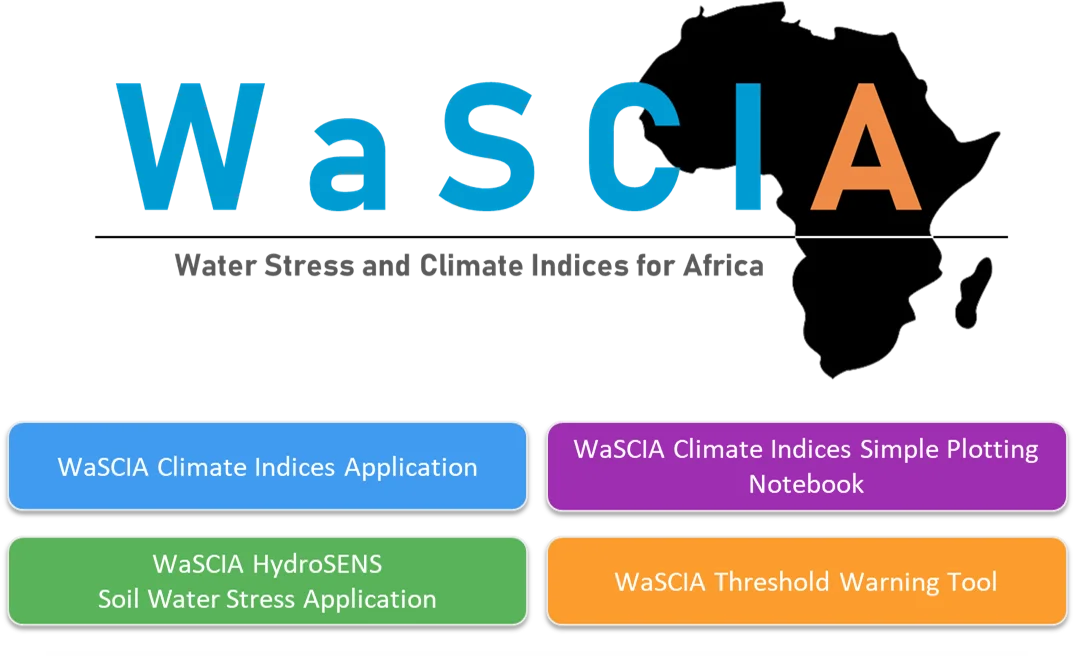
WaSCIA Applications
The WaSCIA project has developed a range of tools to provide:
- Water stress information derived from EO data
- Climate indices derived from ERA5 reanalysis data
- Threshold warnings and decision support information
The WaSCIA applications are deployed on WASDI and are accessible through the WASDI Space Marketplace. These are accompanied by a suite of Jupyter notebooks which sit alongside the generated outputs and enable users to easily interact with the data and extract valuable insights.

WaSCIA Climate Indices Application
WaSCIA Climate Indices application generates Climate Indices from ERA5-Land reanalysis data, for Senegal.
Users are able to generate 20 different climate indices. The outputs are saved to the user’s selected WASDI workspace and can be explored and plotted using a Jupyter Notebook.
Access the application on WASDI here!
In the Space Marketplace, search for the application name: wascia_processor_climate_indicators
This demo video explains the steps needed to run the application.
WaSCIA HydroSENS-Soil Water Stress Application
WaSCIA HydroSENS-Soil Water Stress (SWS) application generates Soil Moisture and Evaporative Water Loss outputs from Sentinel-3 images, for Senegal.
It comprises the following elements:
- Simplified Triangle Processor, for calculating evaporative losses and soil wetness dynamics from Sentinel-3 imagery.
- Random Forest Downscaling, for downscaling to 30 m of the Sentinel-3 derived indicators.
Access the application on WASDI here!
In the Space Marketplace, search for the application name: wascia_hydrosens_sws
This demo video explains the steps needed to run the application.
WaSCIA Jupyter Notebooks
We have developed a suite of Jupyter Notebooks which sit alongside the generated climate indices and enable users to easily interact with the data and extract valuable insights.
Users should download these notebooks here and can then upload them into their own WASDI workspace to use them.
- WaSCIA Climate Indices Simple Plotting Notebook
This notebook has been prepared to demonstrate some simple plotting of the WaSCIA climate indices.
Designed to sit alongside the user’s WASDI workspace. After running the climate indices application (wascia_processor_climate_indicators) and generating the climate indices of interest, the notebook will read these output data files directly from the user’s workspace.
The notebook provides a number of plotting functions to generate a range of common timeseries and heatmap plots.
While not all the plots will be relevant for all of the indices, these plots are intended as examples and we encourage the users to select the most appropriate plot for their purpose and/or adapt the code as necessary.
Download the WaSCIA Climate Indices Simple Plotting Notebook here!
Then upload and run the notebook in WASDI. This demo video explains the steps needed to run the notebook.
- WaSCIA Threshold Warning Notebook
This notebook has been prepared to enable users to compare the climatology and the in-season time-series of a selected climate index.
Designed to sit alongside the user’s WASDI workspace. After running the climate indices application (wascia_processor_climate_indicators), the notebook will read these output data files directly from the user’s workspace.
- Climatology Generation: For the selected climate index, the notebook will calculate the climatology of that index, using historical data from the baseline period 1981 to 2010. This can be used as a reference to understand how the climate index typically varies throughout the year.
- Threshold Definition: For the comparison of a specific year with the climatology data (1981-2010), the warning thresholds can be set in the following ways:
- Percentiles: To calculate percentiles of the baseline climatology data for the specific climate index, e.g. 90th percentile or 10th percentile are useful to highlight the climate extremes. This approach accounts for the variability in local climate.
- Standard deviation: To calculate the standard deviation of the baseline climatology data for the specific climate index.
- Absolute Values: To define absolute threshold values, such as 4 or more heavy precipitation days (precipitation above 20 mm) per week, which may be considered a warning threshold for flooding at a specific location.
- Decision Support: The tool generates a user-friendly plot of the climatology and the time series of a selected climate index. It also provides a description of the plot, so the user can easily detect the periods that fall outside of the thresholds selected.
Download the WaSCIA Threshold Warning Notebook here!
Then upload and run the notebook in WASDI. This demo video explains the steps needed to run the notebook.
